A Guide to Architectural Diagrams: Which Ones to Use and Why?

Table of Contents
How do you choose to convey your design ideas during the conceptual design phase of the project? How do you justify your design before you have any technical drawings? Although there are various ways to express your design ideas, it is usually through the architectural diagrams that architects deliver in clear minimal drawings. They start off as sketches that will be polished later on to become proper diagrams.
Why are architectural diagrams an important part of design development? There are many types of these diagrams, so which one is the right one to use? This guide will take you through these questions and more to familiarise you with architectural diagrams and their uses in the project.
What Is An Architectural Diagram?
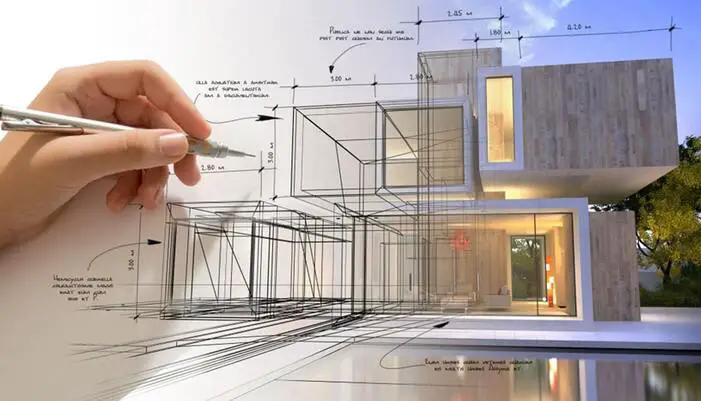
Architectural diagrams are the synthesis of a project: they convey the programmes and strategy defined by multiple factors. It is a visual language and is a great tool to generate and communicate your design ideas as you begin a project. They are neither precise nor scaled to be technical drawings or models, but can be in both the form of 2D and 3D objects. We can classify these diagrams as conceptual or schematic as they show relationships between design elements and ideas in simple abstract images.
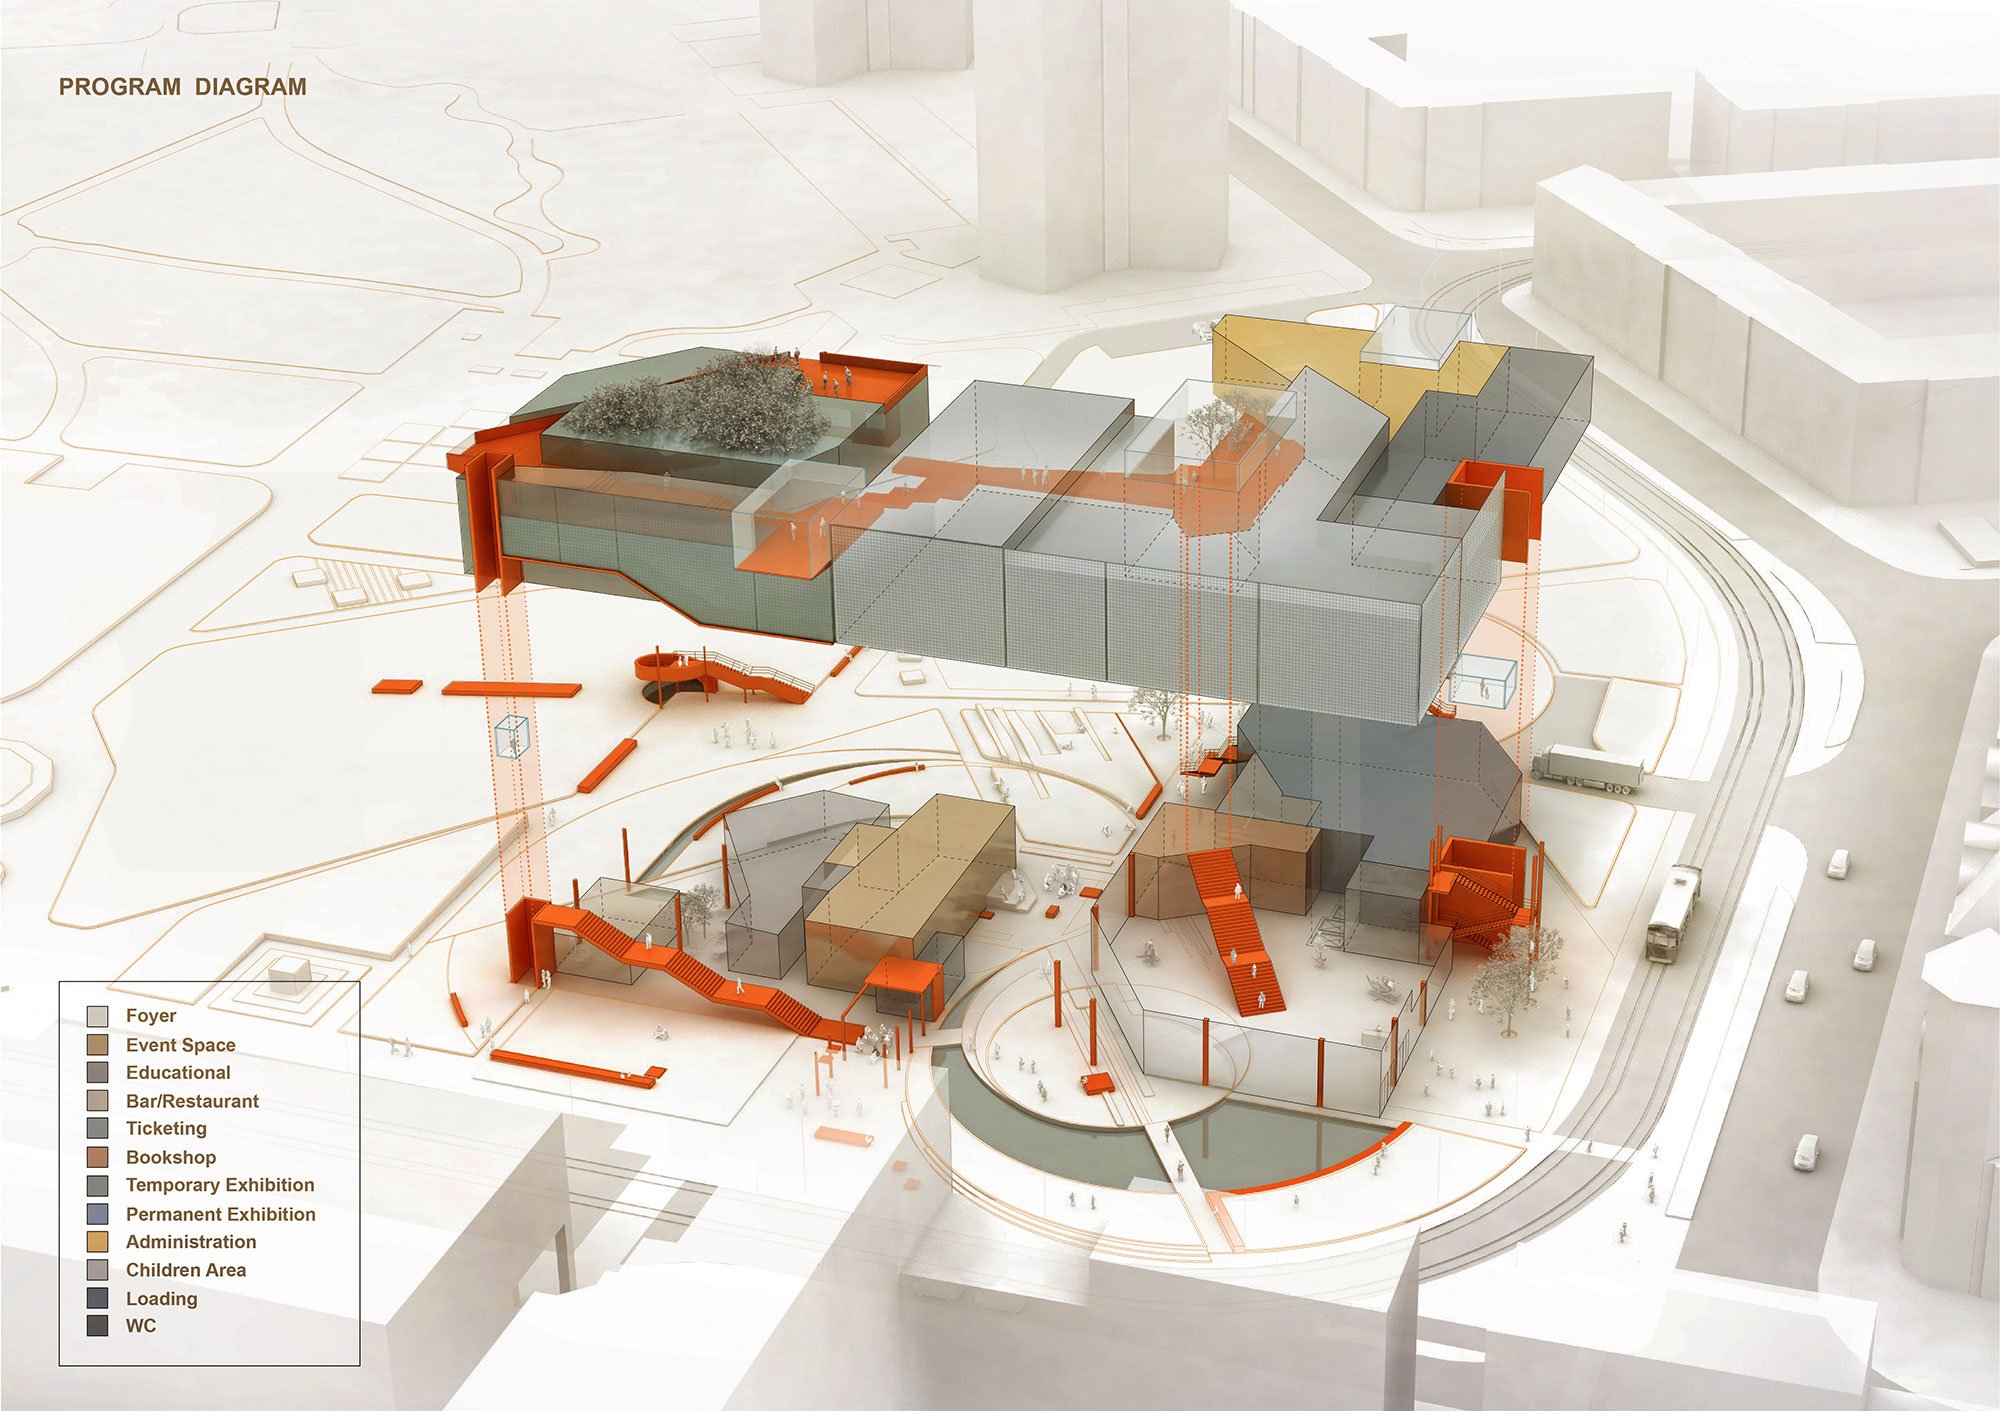
They represent the form and relevant geometries of the site, but the actual built form is a result of the ideation and design development using these architectural diagrams. Additionally, architectural diagrams help architects generate more ideas thereby creating a sequential diagram of how the design comes about.
Architecture diagrams help make a compelling architecture portfolio as well.
Difference Between Diagram And Drawing
In architectural design, we use the words ‘diagram’ and ‘drawing’ too often. But are they the same?
Technically, diagrams are drawings too, because we ‘draw’ them. Nonetheless, they are not construction drawings that show precise dimensions or materials. With the architectural diagrams, we visualise the idea. Only when the design has been finalised, we produce the construction drawings based on the 3D models.
If you use AutoCAD, you will create these drawings individually. But with a BIM tool like Autodesk Revit, these drawings can be produced automatically. This is one of the main arguments in the AutoCAD vs Revit debate.
Are Architectural Diagrams Just Visually Appealing?
While it is true that architectural diagrams convey design ideas, there are different types of diagrams, each with their own function. They are generally colourful and more artistic than sketches and technical drawings, hence, for many architects, they are more of an afterthought, as a way to create eye-catching graphics for presentations.
In reality, architectural diagrams replace a loaded paragraph full of text. Remember - a picture tells a thousand words. Wherever possible, use diagrams to present your ideas on presentation boards and architectural portfolios rather than writing a long paragraph describing what is happening in your design.
Are you struggling with architectural portfolios? It is a difficult process, but a necessary one. Here are some helpful tips for a great architecture portfolio layout to get your dream job.
What Information Do Architectural Diagrams Represent?
The reason why architectural diagrams cannot be an afterthought in your presentation is that they show plenty of information – of the site, the programme and the user behaviour.
For the site, the information comes from the site analysis. They include, but are not limited to -
- Ventilation
- Lighting
- Circulation and traffic
- Vegetation
- Views
If you are creating planimetric diagrams for the surroundings, you can also include the building typologies and traffic in the neighborhood. For a thesis, site analysis is very important.
Similarly, we can identify elements that are a part of the programmatic diagrams.- Programmes and functions
- Spaces
- Levels
- Relative scale (of each space)
Types Of Architectural Diagrams
Architectural diagrams come with a variety of details, colours and representations. Regardless of the type, there are a few similarities:
- Every element in a diagram is indicated by colour coding and legends.
- The use of the right arrows and lines are important.
- It may just be a diagram but the thickness of the lines and arrows cannot be ignored.
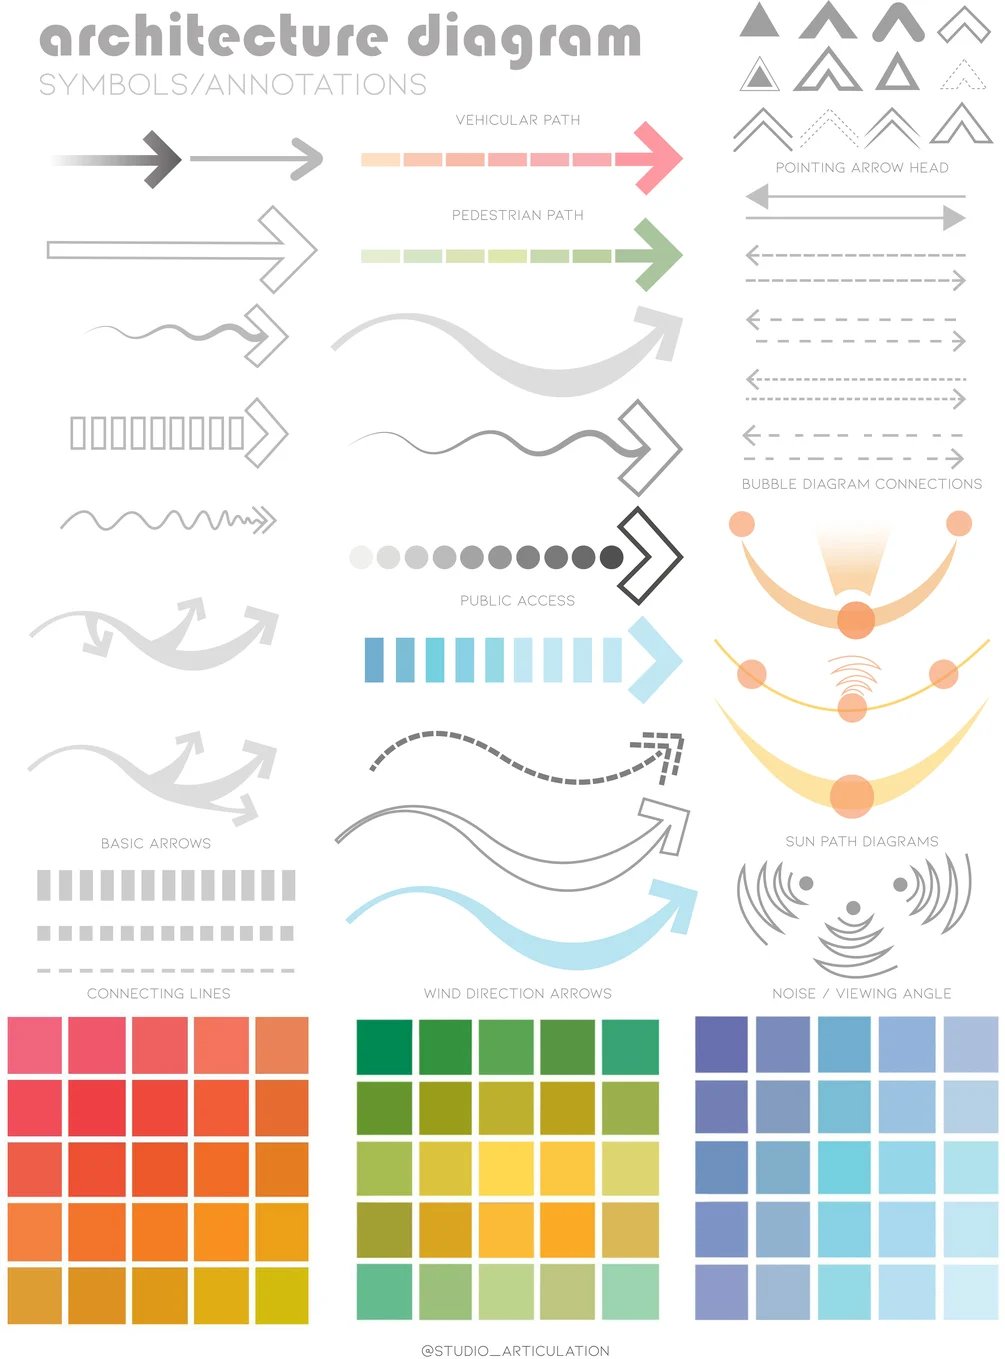
It is ultimately up to the architect to decide how to present the information. The 9 architectural diagrams below are the most common types of diagrams loved by architects.
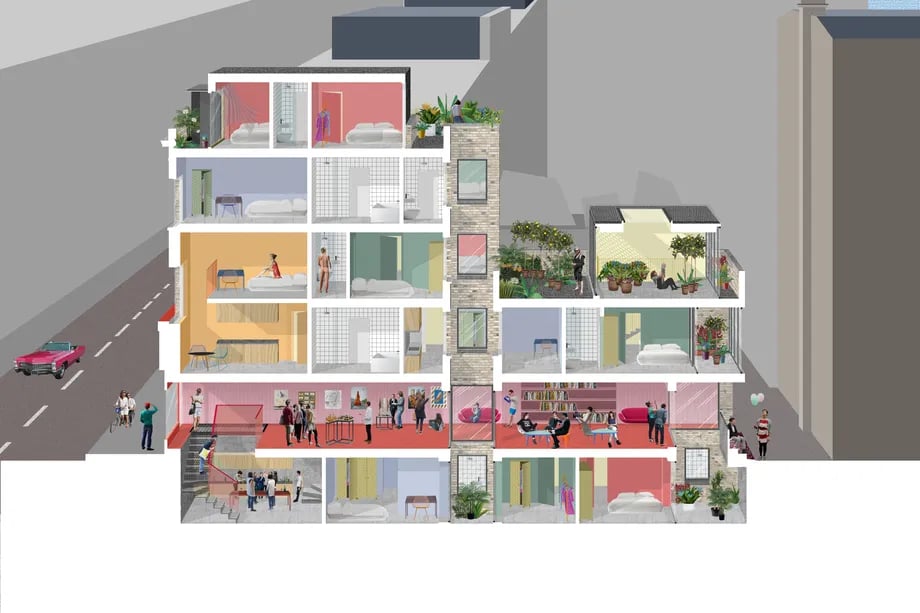
1. Sectional
These diagrams show the conceptual idea with the vertical sectional cut through the building. Usually, a sectional architectural diagram includes indications of programmes, vertical circulation, ventilation, landscape and daylighting. Although it is not to the scale of the actual building, the diagram relates every aspect of the design to human scale. Therefore, it cannot be used as the instruction for the construction phase.
2. Planimetric
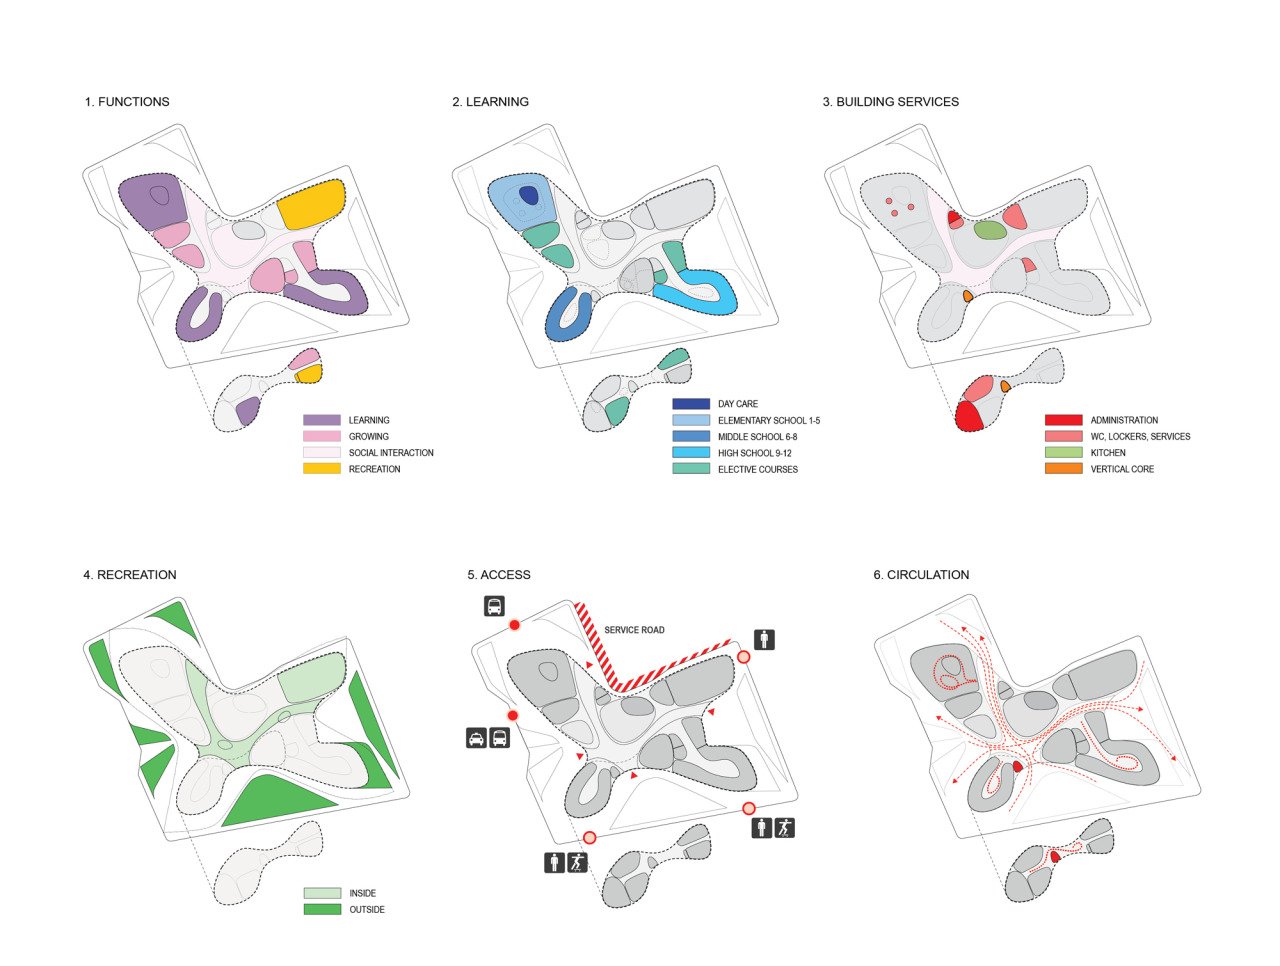
If sectional diagrams show vertical circulation, it is the planimetric diagrams that indicate the horizontal circulation in a space through a plan view. This type of architectural diagram is often used for spatial composition and relations, programmes and views.
3. Axonometric
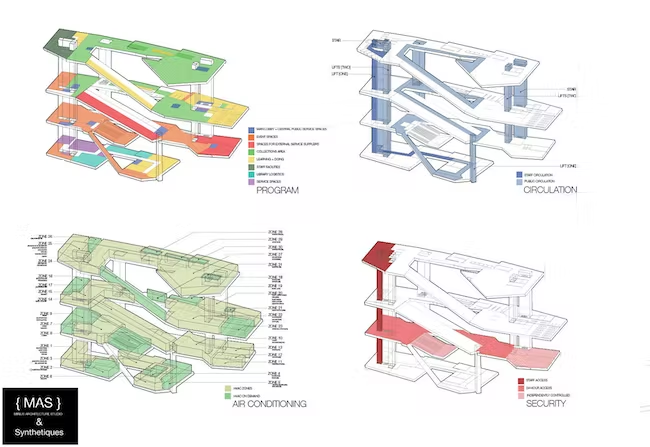
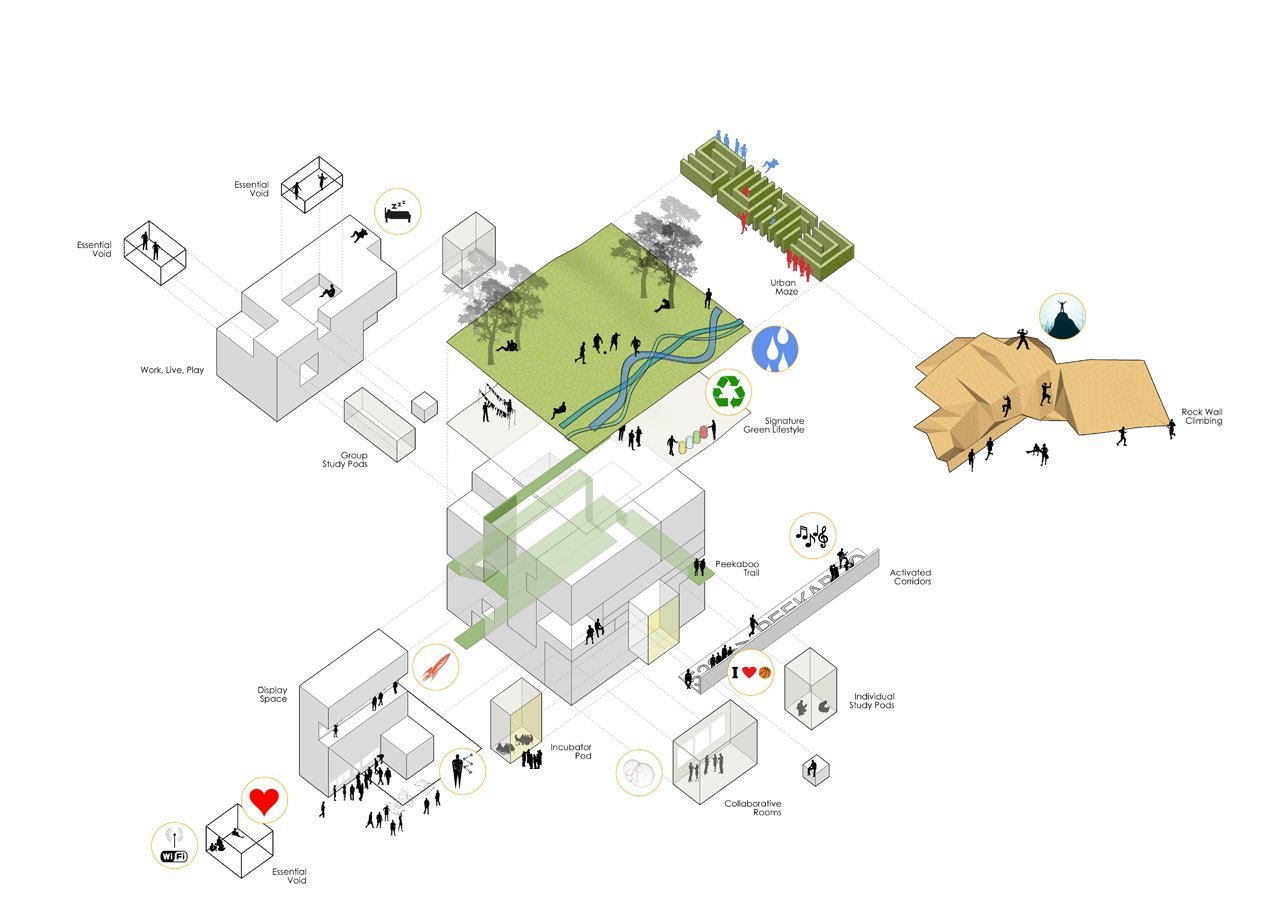
To combine the horizontal and vertical elements, we can use axonometric architectural diagrams where the concepts and elements are viewed from the ‘exterior’. Axonometric diagrams can either show a whole building or a 3D view of each floor and/or elements. Both are typical diagrams in architectural presentation boards as they can show all the design concepts.
4. Circulation
Circulation diagrams are essential to understand the traffic and movement in and out of the building. Normally, these diagrams focus the movement inside, but we can also create diagrams that show both the vehicular and pedestrian traffic around the site. Together with the spatial programmes, circulation diagrams can determine the flow of users and the public and private spaces. In fact, the public and private spaces can also affect the circulation – any unwanted traffic should be avoided in the private spaces.
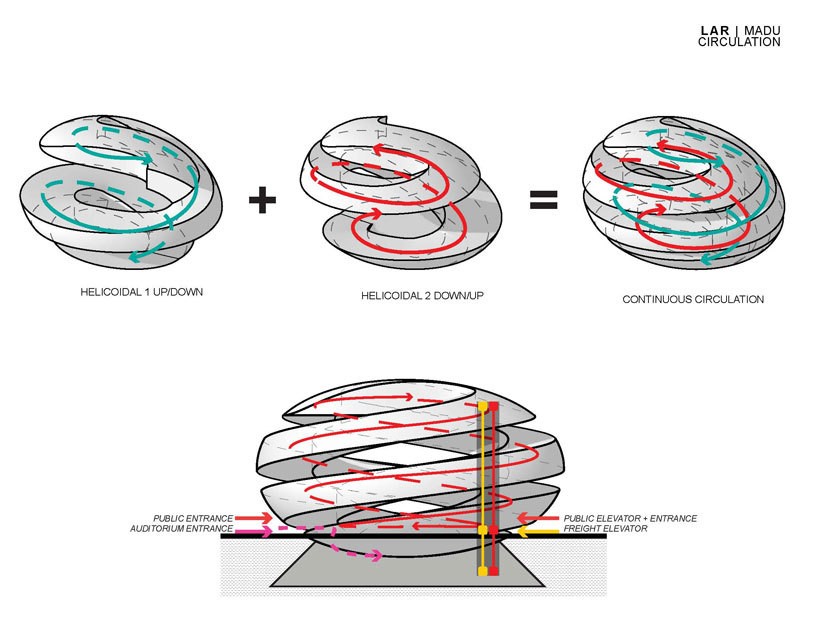
5. Sequential
Sequential architectural diagrams work slightly differently from the rest. Rather than having just one or two diagrams to represent an idea, there can be up to 8 or 10 diagrams. These diagrams best show a derivative design process where an element remains constant throughout. Only 1 or 2 variables are at work in each step. Therefore, these diagrams should follow the right sequence and are preferably numbered.
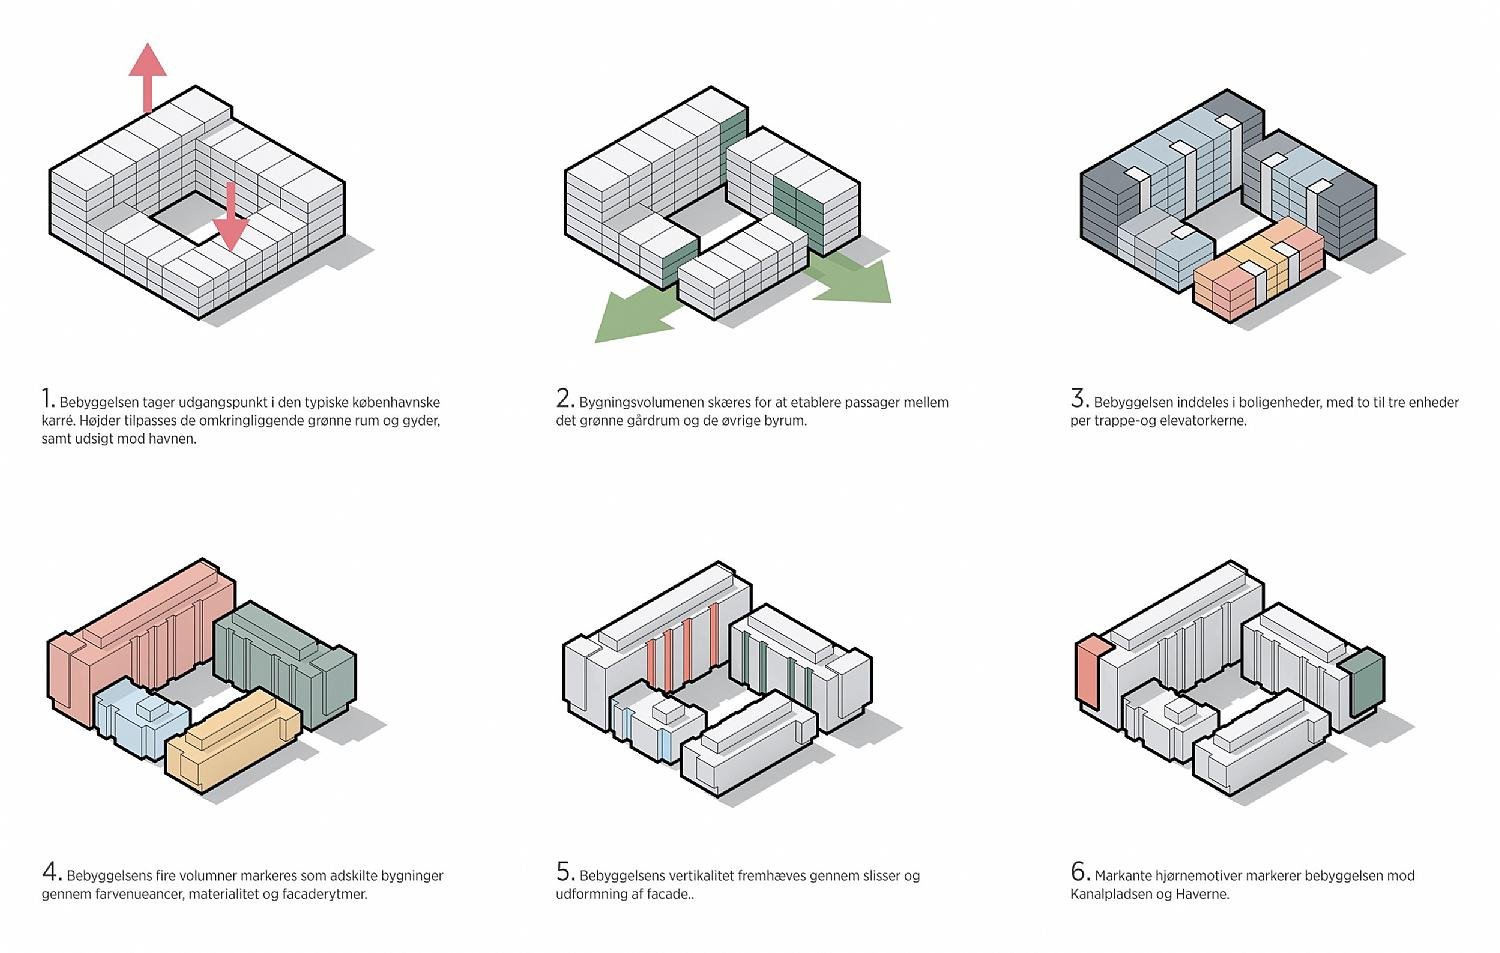
6. Parti
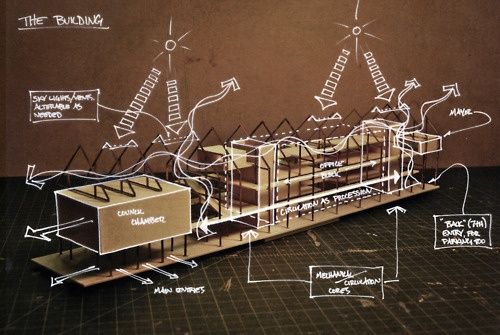
Another commonly used diagram in architectural design processes, parti diagrams deliver the overall design concept. Architects create parti diagrams, or sketches, in the early schematic design phase, relating the concept loosely to the spaces. Built forms, programmes and circulations are some of the elements present in a parti diagram. As a means to show the overall concept, it is important to have good visual communication with proper line weights and styles, shading, sequencing and scale.
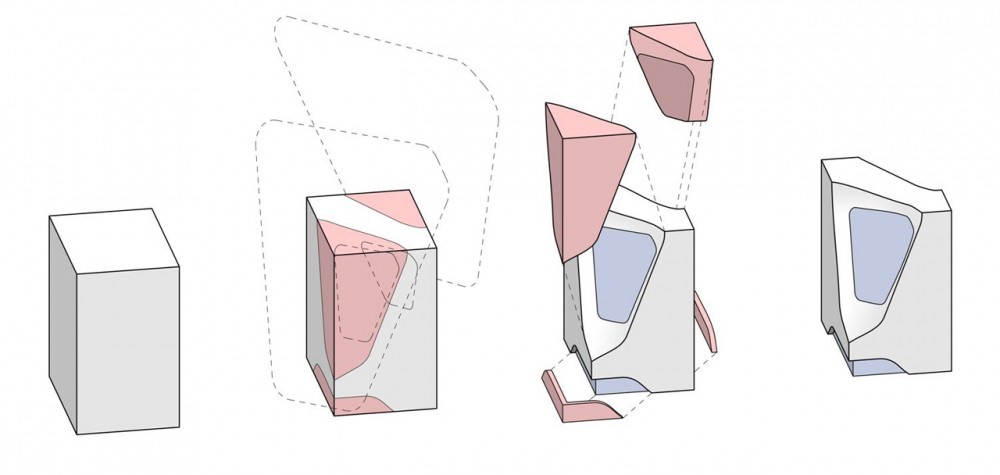
7. Programmatic
Programmes and composition are the main elements of a programmatic diagram. This type of architectural diagram can coincide with sectional, planimetric and axonometric diagrams to relate the programme functions to the right space. They are a great way to start allocating the spaces to the type of programme. The programmes can be either activities or spaces themselves.
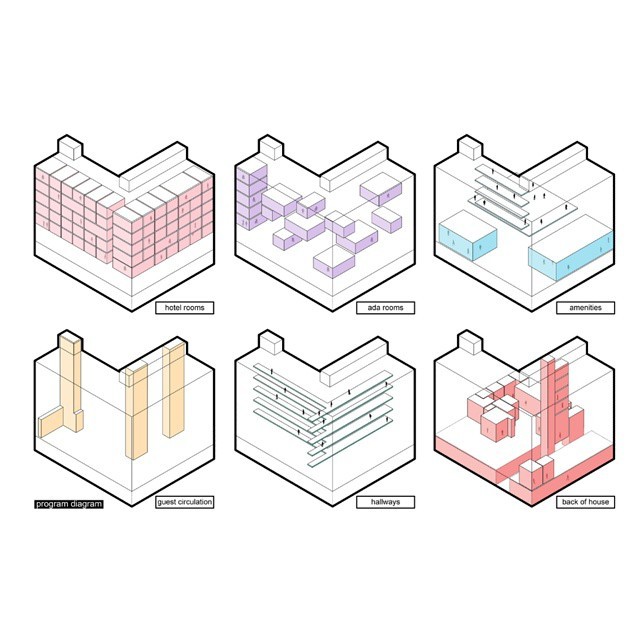
8. Structural
Structural diagrams would usually come at a later stage of conceptual design phase where the building structure becomes an important integral. Just like the programmatic diagrams, the structural elements are shown in planimetric, sectional or axonometric. The best option would be the axonometric which can be exploded to show each part of the structure. Once again – these structural elements just show the idea behind the concept and do not represent the actual construction drawings.
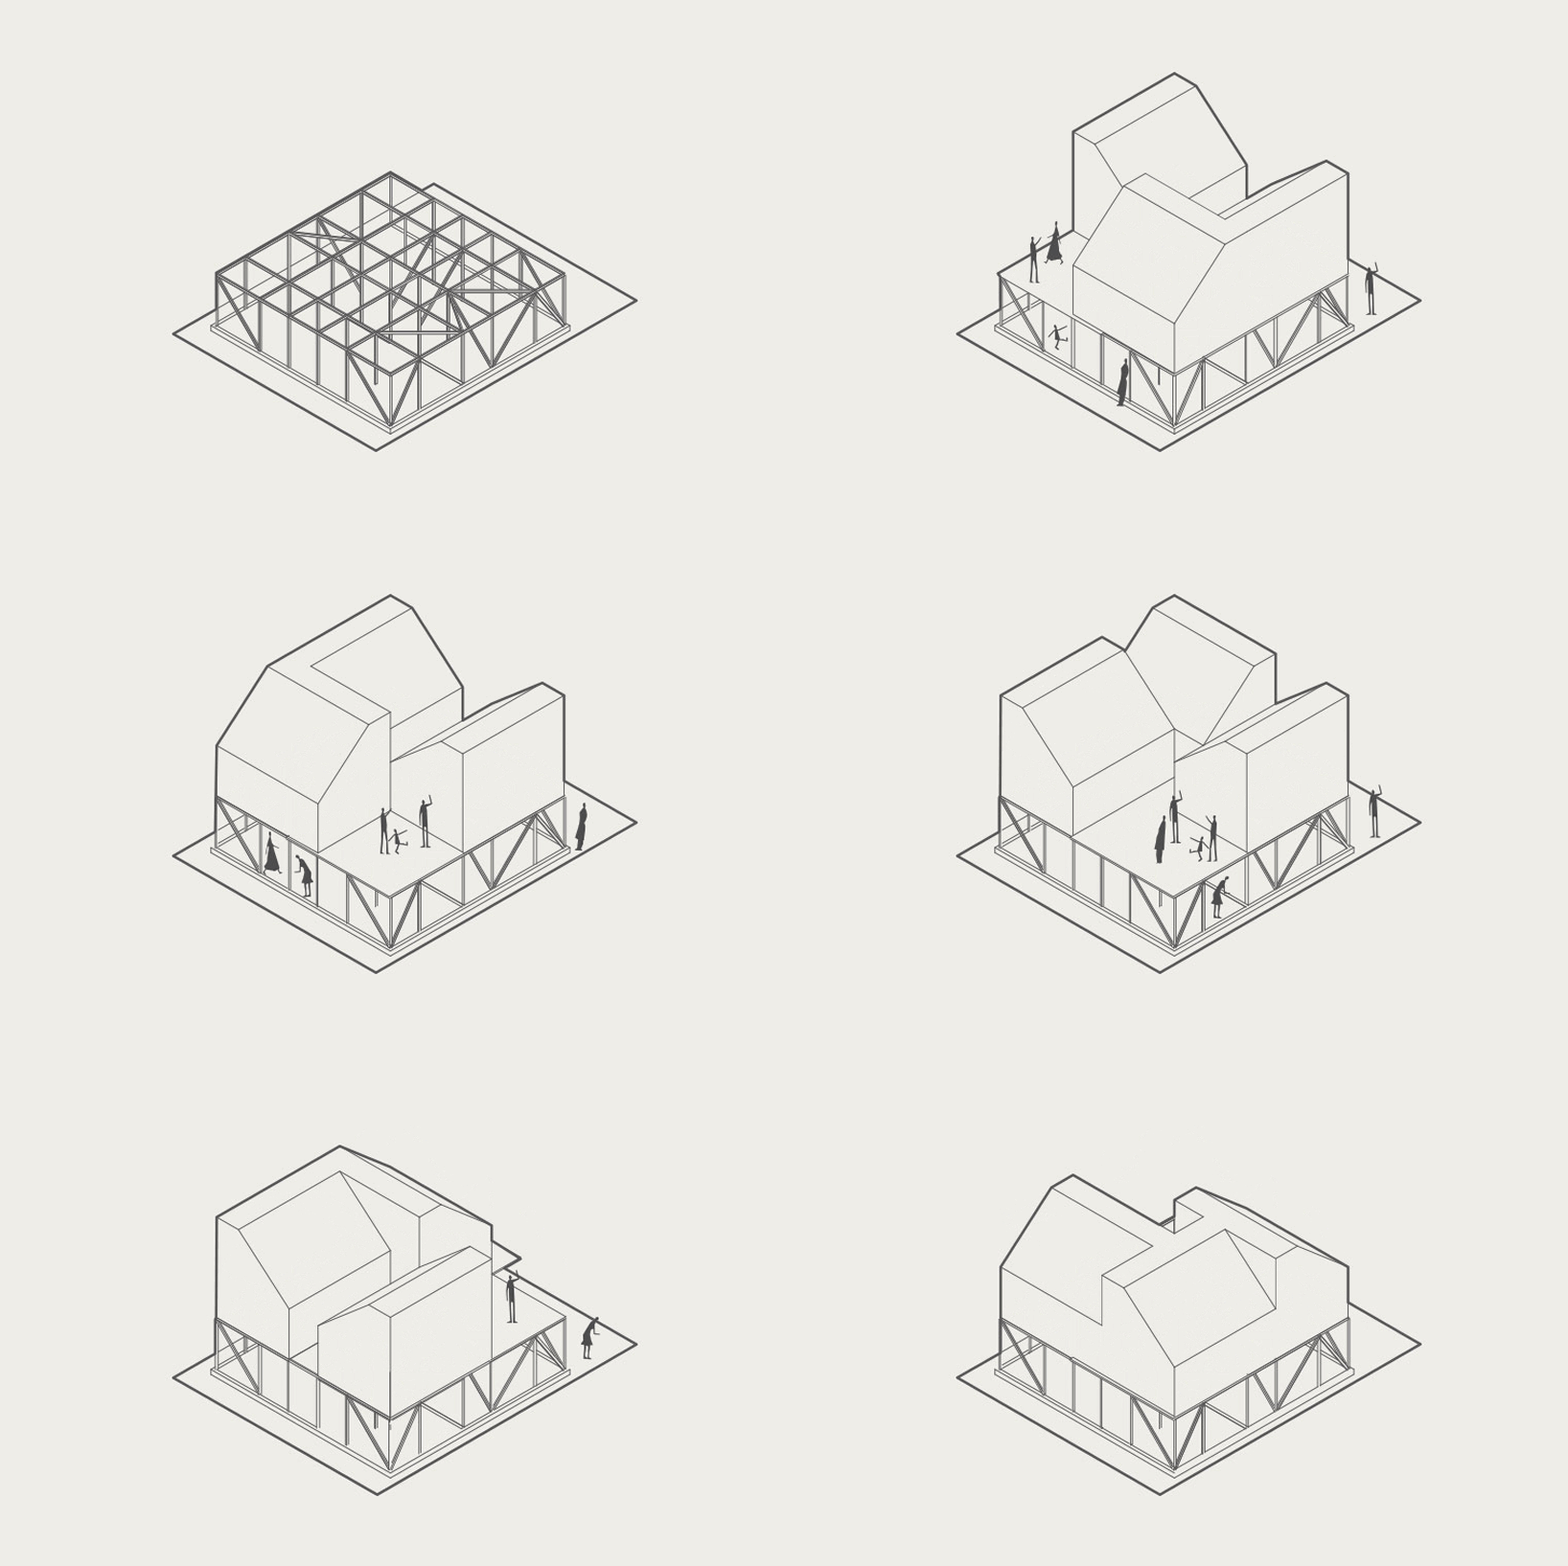
9. Bubble Diagrams
Of course, we cannot leave bubble diagrams behind! Bubble diagrams are programmatic diagrams that show the spaces, their purposes, relative dimensions and scale. Based on the bubble diagrams, we can determine the relationship between each space in a design project.

If you have reached this section (well done!), you will notice there are several ways to describe the spaces and the programmes. There is no right or wrong way to experiment. Create multiple diagrams and generate endless ideas. Just try to avoid creating too cluttered information in a single diagram.
Do you know that BIM software like Revit can assist you in creating site analysis and sustainability assessment? All the information will also be readily available in the 3D model so you can get right to optimising your design. It’s no wonder BIM is in demand nowadays.
Conclusion
This blog took you through the highs and lows of Architectural Diagrams highlighting over it’s importance and usage. Moreover, we also talked about the different types of Architectural diagrams from Planimetric to Parti.
Also, do you know that BIM software like Revit can assist you in creating site analysis and sustainability assessments? All the information will also be readily available in the 3D model so you can get right to optimising your design. It’s no wonder BIM is in demand nowadays.
Join us in our BIM Professional Course to master this in-demand skill, right from the foundations. Learn from industry experts from top AEC firms with years of experience working with BIM. You will be leaving with both theoretical and practical knowledge by the end of the course!
For more tips and insights, head to our Resources page.

 Thanks for connecting!


.png)


-1.png)
